What is this?
Some clever people recognized that CS Majors suck at drawing, but still often need to draw graphs. Those noble souls made a program to draw graphs for us called GraphViz, it's free, open source, and great, but not incredibly easy to use, So I threw this web interface and tutorial on top of it to make it easy for us to make graphs for our assignments.
What?
Convert a simple language that describes graphs, to pretty pictures of graphs.
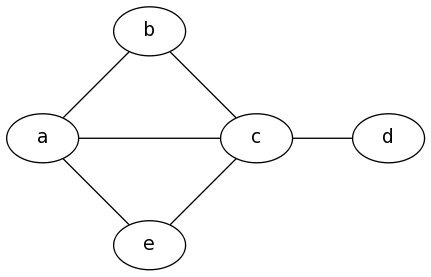
graph {
    a -- b;
    b -- c;
    a -- c;
    d -- c;
    e -- c;
    e -- a;
  }
Cool, Where do I start?
Take a look at some Examples to see how this works, Then open the reference and the Graph page and go to work.